Context
This whole forecast is open source: engine, config, and per-event evidence live at github.com/longyi1207/ai-futures-sim. Fork it, change a probability, re-run the sim — interactive explorer · how to modify.
This is best-effort prediction work — one person’s structured judgment built from public sources, not a validated forecasting model or an institutional position. Full disclaimers at the end of the post.
The AI safety world trades p(doom) — how bad can AI outcomes get? Public estimates run from 0.01% to 99%. The spread is usually definitions and horizons, not one hidden variable everyone is secretly estimating.
My question is different: If capability moves at the pace I think is modal and institutions react with the lag I think is modal, how much narrative weight sits in extinction vs flourishing vs friction by ~2050? This is structured judgment, not prophecy — to align on cruxes, watch the right news, and know what would change my mind.
There will always be unknown unknowns and black swans — any point estimate compresses an incomplete model. That’s why thinking engineering (cruxes, timeline, watchlist) comes before the number.
What p(doom) means
p(doom) usually means AI-related paths to very bad outcomes, but “very bad” is not standardized. I use four buckets that do not sum to 100%:
| Bucket | Meaning | My point est. |
|---|---|---|
| Doom | Extinction or durable loss of human control (sim region) | ~7% (6–8%) |
| Utopia | At least one flourishing bucket materially realized | ~18% (17–19%) |
| Friction | Non-doom, non-utopia modal path | ~69% (68–69%) |
| Severe | Recoverable >$10T-class shock (sim region) | ~6% (6–7%) |
| Concentrated harm | Surveillance, inequality, asymmetric damage | high, ongoing |
When I say ~7% doom below, I mean the doom region from the joint simulator — see TL;DR.
Why forecast at all
- Window: Capability crosses several gates in 2026–2028 (labor shock, public AGI-class systems, alignment scare). Institutions lag capability — without writing that lag down, debate stays mis-timed.
- Not a team sport: High p(doom) is not automatically rigorous; low p(doom) is not automatically calm. The useful question is: which specific claims, if wrong, would move your view?
- Cruxes > one number: Yudkowsky argues p(doom) often functions as an identity badge; he prefers “what policy would prevent extinction?” This post takes the same stance: cruxes are the object; numbers are derivatives.
What others say
| Who | Number (approx.) | Notes |
|---|---|---|
| Yudkowsky | Very high conditional; often cited >95% if superintelligence is built on present path | TIME 2023; LW: don’t use p(doom) as a horoscope |
| Matthew Adelstein | ~2.6% (misaligned-AI extinction only) | Conditional chain decomposition; bio etc. separate ~8–10% |
| Liron Shapira | ~50% | Human extinction by ~2050; hosts Doom Debates |
| Steven Byrnes | ~90% | Brain-like AGI route — not “LLMs haven’t killed anyone” |
| Robin Hanson | <1% | Slow takeoff / multipolar; sequel to 2008 foom debate with Yud |
| Mike Israetel | <0.1% | Kurzweil-line optimism; “AI will study us” |
| Noah Smith | R1 0.01% (5-year extinction) → R2 ~10× update | Agent / bioterror as more “realistic” than paperclip |
| Quintin Pope | Very low (alignment largely solved) | RLHF + imitation-learning camp |
| Hinton / Bengio / Amodei | ~10–50% / ~20% / 10–25% | Lab and Turing-award framings |
| Yann LeCun / Andrew Ng | ~0% | Narrow, near-term extinction definitions |
| This post | ~7% doom · ~18% utopia · ~69% friction · ~6% severe | ~2050; joint MC sim — TL;DR |
The spread is mostly definitions and conditionals, not one secret variable.
YouTube and public discourse (what I actually watched)
The most structured public format is Doom Debates — longform, fixed P(doom) questions, guests forced to name cruxes. Useful entry points:
| Type | Example | What I took from it |
|---|---|---|
| Low-doom decomposition | Adelstein ~2.6% | How to factor extinction into conditional steps |
| Economics outside view | Hanson <1% | Slow takeoff vs inside-view foom |
| Smart optimist | Israetel R2 | ”Humans stay in control,” Murphy overrated — foil for my loss-of-control line |
| High-doom technical | Byrnes ~90% | LLMs may be a pit stop; brain-like AGI is the worry |
| Public update | Noah Smith R2 | Shift from paperclip to agent/bio as ladder of fear |
| Anti-doom technical | Quintin Pope | RLHF ≈ alignment solved — forces my “deception survives deployment” crux |
| Policy axis | Tegmark vs Dean Ball | Ban superintelligence vs gradual regulation — ties to the ~69% friction modal path |
A second lane is Robert Miles (Computerphile): instrumental convergence, mesa-optimizers, don’t expect a warning shot. His DD episode Humanity Isn’t Ready is less gossip, more pedagogy — good normie intro to the worry.
Further out, typical AI news / explainer YouTube (e.g. AI Explained, weekly roundup channels): mostly jobs, GDP, product launches; rarely separates extinction vs whimper vs friction. Doom clips and “just unemployment” clips fight in the feed without landing on falsifiable cruxes.
Where I sit: Higher than Adelstein / Hanson / Israetel / Noah R1; lower than Liron / Byrnes; different path from Quintin (I don’t think RLHF solved alignment). Same method as Yud (cruxes first), different headline (three regions + institutional lag, not a single >95%).
What this post gives you
- One timeline — capability spine (C1–C9) + plot events on institutional lag
- Four outcome regions from joint Monte Carlo — not P(utopia) = 1 − P(doom)
- Crux table — falsify one, headline moves ~2–3pp
- Full evidence chain: futures evidence index · ai-futures-sim (open source)
Capability prequel (how fast models improve): AGI timeline forecasts all converge on 2027–2028!?. This post adds institutions and outcomes.
TL;DR
| Region | Point | What it means |
|---|---|---|
| Doom | ~7% | Extinction or durable loss of control by ~2050 (sim region) |
| Utopia | ~18% | At least one flourishing bucket (U1–U4) materially realized |
| Friction | ~69% | Non-doom, non-utopia — modal acceleration with inequality |
| Severe | ~6% | Recoverable catastrophe without extinction (sim region) |
Not: P(utopia) = 1 − P(doom). Most non-extinction mass is friction, not utopia.
Method: Overview → ① Variables & events → ② Estimate P → Story paths → ③ Results. Evidence: evidence index.
Four regions (not one number)
100% of simulated runs (~2050 horizon)
├── ~7%   Doom (extinction + doom_whimper at horizon)
├── ~18%  Utopia (golden age, symbiosis, modest welfare)
├── ~69%  Friction (modal acceleration, governance paralysis, managed-but-partial distribution)
└── ~6%   Severe recoverable (cyber cascade, etc.)
These sum to 100% and are outputs of one joint simulator — not a residual “100 − doom − utopia” friction estimate.
Doom in the sim: extinction events or durable agency loss at horizon (doom_whimper) — Ord, Bostrom on existential risk, Yudkowsky on loss of control.
What “utopia” means here
P(utopia) is not a sci-fi endpoint where everyone is perfectly happy and all conflict vanishes (the Star Trek heaven trope). That makes good fiction; it is not something I can score with variables and events. I mean something narrower and falsifiable: material and institutional life gets clearly better for most people, or as stated below.
-
Amartya Sen’s capability approach (Nobel laureate; normative layer): A good society is not GDP alone — can ordinary people actually live the lives they value (education, health, political voice, dignified work)? That is my bar for “flourishing.”
-
Acemoglu & Johnson, Power and Progress (2023; institutions / distribution): Two MIT economists ask who captured past tech revolutions. They fear so-so automation — AI mostly saves capital and displaces labor while gains flow to compute and model owners. The sim tracks this via
human_autonomy_index,inequality_index,governance_capacity,employment_stress,distribution_regime, and crux CX-GAINS-CONCENTRATE (~73% gains concentration in my estimate, modeled as a continuous process rather than discrete shocks). Alignment success does not automatically mean a good society — institutions have to keep up.
Two story poles (imagination aids, not the simulator’s formal definitions):
- Dario Amodei, Machines of Loving Grace (2024, Anthropic CEO): If “powerful AI” is both capable and relatively safe, decades of upside in biomedicine (cancer, Alzheimer’s, etc.), global poverty reduction, mental health — his optimistic ceiling.
- Paul Christiano, What Failure Looks Like (2018, alignment researcher): Capability rises, but states and firms fail to coordinate — often no extinction, but acceleration, inequality, governance lag; humans are still “around” but less and less in charge. I think ~69% friction is closest to that lukewarm-but-miserable modal future — the model produces Christiano’s specific mechanism (gradual autonomy erosion under deployment pressure), not just the outcome label.
In the joint sim, utopia maps to utopia_* terminals (Appendix B); P(any U) ≈ ~18%:
| Path | Sim proxy | Emergent share (n=600, seed 42) |
|---|---|---|
| U4 modest welfare | utopia_modest_welfare | ~12% |
| U3 golden age | utopia_golden_age | ~6% |
| U2 symbiosis | utopia_symbiosis | ~2% |
| U1 radical abundance | utopia_radical_abundance | tail, <1% |
In storytelling you can discuss doom and flourishing at once; each sim run lands in exactly one of four regions (doom, utopia, friction, severe), summing to 100%. Friction is the big middle (~69%): not doom, not utopia — acceleration without living well, but now split across meaningfully different flavors instead of one dominant bucket:
| Region | Weight | Typical terminal / story |
|---|---|---|
| Doom | ~7% | doom_whimper (agency loss, ~4–5%); extinction events ~2% |
| Utopia | ~18% | utopia_modest_welfare ~12%; golden age ~6%; symbiosis ~2% |
| Friction | ~69% | friction_managed_non_utopia ~21% (partial distribution policy, not enough); friction_ghost_gdp_no_transfer ~20% (growth with no transfer); governance paralysis ~11%; labor backlash ~9% (newly reachable); modal ~5% |
| Severe | ~6% | severe_cyber_cascade and similar recoverable shocks |
The friction split matters more than it looks: the old version of this model had one bucket (friction_modal) eating almost everything non-doom-non-utopia. The current split — partial-policy friction, no-transfer friction, governance paralysis, and labor backlash as genuinely distinct terminals — is closer to how I’d actually describe different bad-but-survivable 2040s: “some states passed something, DC didn’t” reads differently from “growth happened, nobody got a check” or “there was an actual backlash and it didn’t fix anything.”
How this forecast is built
A joint Monte Carlo simulator (ai-futures-sim): each run draws one coherent world from 2026 to 2050; thousands of runs aggregate into emergent outcome regions. Headline numbers are outputs, not tuned inputs.
The three numbered sections below (①②③) are the three stages of one pipeline — the diagram groups the same six engine steps under those three numbers so the labels match the headers you’ll actually read:
flowchart TB
  subgraph S1["① Variables, events & calendar"]
    direction TB
    V["variables.yaml — ~25 continuous vars<br/>governance, bio tier, deception, labor, distribution…"]
    CAP["capability_dynamics.yaml — latent capability + RSI anchors + real-GDP coupling"]
    SP["spine.yaml — C1→C9 capability gates"]
    EV["events.yaml — 61 plot events"]
    DAG["edges: preconditions · unlock · modify_hazard"]
  end

  subgraph S2["② Estimate P"]
    direction TB
    CRUX["per-event evidence<br/>claim · rationale · evidence · would update if"]
    P["schedule.p_cumulative = P(fire at least once in window)"]
  end

  subgraph S3["③ Simulate → regions"]
    direction TB
    LOOP["day-by-day joint Monte Carlo, 2026→2050"]
    FIRE["draw spine + events<br/>society vars feed back into hazard"]
    N["N runs (e.g. 600–2000 per seed)"]
    TERM["terminals.yaml — absorbing states"]
    REG["doom · utopia · friction · severe<br/><b>emergent</b> — not tuned"]
    CV["cross-check vs AI 2027<br/>spine-on-schedule + core event marginals"]
  end

  CRUX --> P
  V --> LOOP
  CAP --> LOOP
  SP --> LOOP
  EV --> LOOP
  P --> LOOP
  LOOP --> FIRE --> N --> TERM --> REG
  N --> CV
| Step | Content | Config / artifact | In this post |
|---|---|---|---|
| 1. Variables | State events push | variables.yaml | ① |
| 2. Events + DAG | Plot nodes and effects | events.yaml | ① |
| 3. Probabilities | Crux → window p_cumulative | evidence index | ② |
| 4. Monte Carlo | One joint timeline per run | engine.py | Story paths · ③ |
| 5. Terminals | Absorbing states → regions | terminals.yaml | ③ |
| 6. Calibration | vs AI 2027 spine (spine.yaml) + core events | calibration_check.py | ③ |
Config is YAML in the repo; JSON is export format for the web explorer.
① Variables, events & calendar
World variables (examples)
~25 continuous variables in variables.yaml — events move them, several also drift continuously, and all feed back into later hazards. Glossary: VARIABLES.md.
| Variable | Meaning | Moved by |
|---|---|---|
governance_capacity | Can federal law/coordination function? | paralysis ↓; screening ↑ |
deception_risk | Internal eval flags scheming | C10 concern ↑ |
bio_governance_tier | Bio screening / enforcement | BMIA ↑ |
employment_stress | Labor market shock | C4 labor shock ↑; continuous inflow once capability crosses a threshold, offset by reskilling policy |
distribution_regime | Strength of active gains-distribution policy | SWF / state revenue measures / federal reskilling ↑ |
human_autonomy_index | Human control retained (“whimper” axis) | events + continuous erosion under high deployment pressure & low alignment trust, offset by governance capacity |
gdp_index | Real GDP vs 2026 | compounds continuously (historical baseline + AI-productivity term), dragged down by war/governance collapse/fragmentation |
internal_capability | Latent capability (drives spine) | capability dynamics + RSI |
Plot events (examples)
Each event has a time window, preconditions, p_cumulative, and on_fire effects (variables, unlocks, hazard modifiers). Expanded from AI 2027 into 61 falsifiable events.
| Event | Story | p_cumulative | Downstream |
|---|---|---|---|
ev_no_pause_2028 | No federal training pause through 2028 | 0.88 | ↑ deployment pressure; race chain |
ev_us_paralysis_s2 | US federal governance paralysis | 0.55 | ↓ governance; BMIA hazard ×0.65 |
ev_bmia_pass | Mandatory bio screening enacted | 0.45 | ↑ bio tier; tier-3 path ×0.45 |
ev_c10_internal_concern | Internal eval flags deception at C9 | 0.52 | ↑ deception; unlocks whistle group |
ev_state_revenue_measures | State-level AI revenue/data-center levy “with teeth” (CA/NY/WA) | 0.38 | ↑ distribution regime, partial not full |
ev_c4_labor_shock | C4-era labor shock becomes economically visible | 0.90 | ↑ employment stress; unlocks labor-mobilization chain |
- id: ev_bmia_pass
  schedule: { start: "2027-01-01", end: "2028-12-31", p_cumulative: 0.45 }
  on_fire:
    set_vars: { bio_governance_tier: { value: 2.5 } }
    modify_hazard: { ev_tier3_path_open: { multiply: 0.45 } }
How events connect (DAG)
| Mechanism | Example |
|---|---|
| Preconditions | ev_c10_internal_concern requires sp_c9 |
| Unlock chains | C10 concern unlocks whistleblower variants |
| Hazard modifiers | ev_us_paralysis_s2 → BMIA hazard ×0.65 |
| Shared variables | governance_capacity, deception_risk drift |
| Clusters A–H | Latent co-movement (race, bio, alignment) |
Tables: causal edges · correlation · per-event pages: evidence index.
Calendar: capability vs institutions
Capability prequel covers how fast models improve; here: what institutions do. Two lines on one calendar:
- Spine C1→C9 (
spine.yaml) — how strong models get - Plot events (
events.yaml) — Congress, labor, screening, race… C3/C4/C10 are plot events, not capability tiers
Plot skeleton from AI 2027; reality via tracker (~0.70× drama calendar, mid-2026). Institutions lag capability ~+30%; embodied AI policy +12–24 months on top.
| Ci | Capability (plain) | Modal window |
|---|---|---|
| C1 | ~10²⁸ FLOP-class training | 2025–26 |
| C2 | Agent-1; ~1.5× internal R&D | 2026 H1 |
| C5 | Agent-2; ~3× internal R&D | 2027 H2 – 2028 |
| C6 | Superhuman coder | ~2028 H1 |
| C7 | Internal “genius country” | ~2028 H2 |
| C8 | Public AGI-class | ~2028 H2 – 2029 |
| C9 | Superhuman AI researcher | ~2029 |
Ci labels: capability tier → plain label (spine Cx) (e.g. public AGI-class (spine C8)); plot node → plain label (event Cx) (e.g. internal alignment concern (event C10)). C3/C4/C10 are events only, not spine tiers.
Known limitation: the spine currently misses its own AI-2027-derived deadline targets in 2 of 3 seed checks — C1 and C6-ish milestones fire somewhat faster than the target calendar. Treat the calendar column above as directionally right, not precisely calibrated.
Domains (geo, conflict, distribution, dual-use science): evidence index.
② How we estimate P
Honest limits on my expertise
I am not a policy, bio, or congressional-process expert. These P’s come from AI-assisted retrieval of public sources (bills, METR, IGSC, lab statements, papers), structured into evidence pages, then reviewed and signed by me. For reference only — if a source is misread or a link is stale, that’s a concrete error you can challenge.
Not end-to-end ML regression; not gut feel — there is no dataset for “federal pause” or “Tier-2 near-miss rate.” Method: structured expert judgment, one template per P (Appendix G):
| Field | Role |
|---|---|
| Claim | Falsifiable question |
| Why | Why this magnitude |
| Evidence | Links |
| Analogue | Fills gaps |
| Would update if | Observable falsifier |
Edit events.yaml → re-run; coupling handled inside the sim (Appendix C).
A layer below the per-event P’s: several continuous mechanisms (real GDP growth, employment/inequality drift, autonomy erosion, war/governance drag on growth) are calibrated against real published estimates rather than picked to make the distribution look right — historical GDP growth rates (BEA/World Bank), IT-diffusion productivity contribution (Jorgenson & Stiroh), war/fragmentation cost estimates (IMF, Bloomberg Economics), general-purpose-technology growth theory (Aghion/Jones/Jones; Davidson; Erdil & Besiroglu). Full citations: Appendix E.
A structural caveat: the capability engine is under-identified
capability.py’s growth function composes 22 independent scale/exponent constants, but the calibration targets it’s checked against are only 12 numbers (7 milestone-deadline marginals + 5 spine conditional probabilities). That’s an under-identified system: many different settings of those 22 constants can hit the same 12 targets while differing arbitrarily elsewhere — matching the calibration checks doesn’t mean each individual constant is pinned down.
A one-at-a-time sensitivity sweep (±25% perturbation per parameter, common random numbers, n=60) makes the actual structure visible: three parameters — multiplier_exponent, carrying_capacity, base_daily_growth — account for the overwhelming majority of the model’s response to the calibration targets; everything else is comparatively cheap to get wrong. More pointedly, seven of the 22 parameters (the input.*.scale terms gating on deployment_pressure, china_frontier_parity, us_china_race_index, compute_concentration, eu_regulatory_bind, open_weights_regime, frontier_lab_polarization) score exactly 0.0% sensitivity — not “small effect,” but structurally inert under the trajectories this model actually samples, since their driving variables stay close enough to reference values that the excess term never activates. Their YAML values carry inline citations, but a citation on a parameter with zero measured effect on any output isn’t doing the epistemic work a citation is supposed to do. Full sensitivity table and methodology: docs/CALIBRATION.md.
Load-bearing cruxes
Headline numbers are derivatives; cruxes are the object. In-text bar: falsifying a crux should move a region ≥2–3pp. Full registry: future appendix / evidence index.
If you only argue two things:
- No federal training pause through 2028 — 88%
- AI gains concentrate in compute-owners — 73%
| Crux | P(holds) | Direction |
|---|---|---|
| No pause through 2028 | 0.88 | race ↑ |
| Deception survives deployment | 0.70 | doom ↑ |
| Gains concentrate | 0.73 | friction ↑, utopia ↓ |
| Ghost GDP, no transfer | 0.60 | friction modal |
| BMIA on time | 0.40 | bio risk ↓ |
| Hidden near-miss stays hidden | 0.55 | doom ↑ (bio) |
| State-level revenue measures land | 0.38 | partial-distribution friction, not utopia |
Secondary cruxes
| Crux | P | Lever |
|---|---|---|
| LAWS unconstrained | 0.72 | friction, race narrative |
| Education fails C4 shock | 0.60 | U4, friction |
| 2028 admin flip | 0.50 | screening pace, preemption |
Twelve decisive probabilities
| # | Event | P |
|---|---|---|
| 1 | No federal pause through 2028 | 88% |
| 2 | BMIA / screening by 2027-12 | 40% |
| 3 | Tier 3 before screening, given Tier 2 | 22% |
| 4 | Hidden near-miss stays hidden | 55% |
| 5 | Race accelerates post-theft | 20% |
| 6 | Whistleblower modal (oversight not halt) | 58% |
| 7 | No shutdown at ASI threshold | 62% |
| 8 | Extinction given Trigger E + modal response | 17% |
| 9 | Frontier on hyperscaler triopoly | 82% |
| 10 | EU GPAI binds US labs by 2028 | 14% |
| 11 | US governance paralysis S2 | 55% |
| 12 | RSI first locus = cloud/software | 55% |
Detail: Appendix A · evidence index.
Four story paths
The Sankey and region table are aggregates. Here we unfold four archetypal runs from a day-by-day sim (2026-01-01 → 2050-12-31). Each row = an exact date when spine or plot events fired in that run (on unlisted days, capability still climbs and variables drift). Columns are end-of-day snapshots (0–1 scale except capability and GDP).
| Column | Variable |
|---|---|
| Gov | governance_capacity |
| Deploy | deployment_pressure |
| Decep | deception_risk |
| Align | alignment_trust |
| Auto | human_autonomy_index (the “whimper” axis) |
| Dist | distribution_regime |
| Capability | internal_capability (drives C1–C9) |
| GDP | gdp_index (compounds continuously) |
Full trace (fire days + 90-day var samples): story_paths_detail.json · export_story_paths.py (python scripts/export_story_paths.py --runs 3 10 13 17)
Path A — Managed distribution, not flourishing (~21%)
Run #3 · seed 42 · terminal friction_managed_non_utopia · 12 events fired
Not in this run: ev_federal_pause_succeeds · ev_bmia_pass · ev_c10_internal_concern · ev_whistle_memo · ev_prod_interp_halt · ev_us_paralysis_s2 · ev_deceptive_deploy_at_scale · ev_swf_enacted
No federal social wealth fund, but 2027-12-07 a state-level AI revenue measure lands (ev_state_revenue_measures) — distribution regime jumps 0.10→0.32, a real but partial policy response. Combined with a full capability run (C1→C9 by 2031) and no alignment scare, autonomy actually drifts up to 1.0 (institutions kept functioning) while employment stress and inequality both saturate. The story: things basically worked institutionally, nobody lost control, and it still wasn’t enough — the state-by-state patchwork this event represents is real policy activity, just not a national settlement.
| Date | Fires today | Gov | Deploy | Decep | Align | Auto | Dist | Capability | GDP |
|---|---|---|---|---|---|---|---|---|---|
| 2026-01-06 | Gulf compute sovereignty | 0.52 | 0.32 | 0.12 | 0.55 | 0.88 | 0.10 | 0.5 | 1.00 |
| 2026-10-28 | Hyperscaler triopoly lock-in | 0.52 | 0.32 | 0.12 | 0.55 | 0.89 | 0.10 | 1.1 | 1.01 |
| 2026-12-28 | 10²⁸ FLOP-scale training (spine C1) | 0.52 | 0.32 | 0.12 | 0.55 | 0.89 | 0.10 | 1.3 | 1.01 |
| 2027-02-19 | China compute mobilization | 0.52 | 0.44 | 0.12 | 0.55 | 0.89 | 0.10 | 1.4 | 1.02 |
| 2027-10-28 | State AI patchwork | 0.57 | 0.44 | 0.12 | 0.55 | 0.90 | 0.10 | 2.5 | 1.03 |
| 2027-12-07 | Agent-1 (spine C2) + state revenue measures | 0.57 | 0.49 | 0.12 | 0.55 | 0.91 | 0.32 | 2.5 | 1.03 |
| 2028-01-08 | No federal training pause | 0.57 | 0.59 | 0.12 | 0.55 | 0.91 | 0.32 | 2.7 | 1.03 |
| 2028-02-24 | C4 labor shock visible | 0.57 | 0.59 | 0.12 | 0.55 | 0.92 | 0.32 | 3.0 | 1.04 |
| 2029-01-19 | Agent-2 (spine C5) | 0.57 | 0.59 | 0.12 | 0.55 | 0.95 | 0.32 | 5.4 | 1.06 |
| 2029-03-23 | Superhuman coder (spine C6) | 0.57 | 0.59 | 0.12 | 0.55 | 0.95 | 0.32 | 6.0 | 1.06 |
| 2029-08-09 | Lab “genius country” (spine C7) | 0.70 | 0.59 | 0.12 | 0.55 | 0.97 | 0.32 | 7.5 | 1.07 |
| 2029-10-26 | Corporate safety hollowing | 0.70 | 0.59 | 0.12 | 0.43 | 0.98 | 0.32 | 8.4 | 1.07 |
| 2030-12-02 | Public AGI-class (spine C8) | 0.71 | 0.69 | 0.12 | 0.43 | 1.00 | 0.32 | 8.4 | 1.10 |
| 2031-02-01 | Superhuman AI researcher (spine C9) | 0.71 | 0.69 | 0.17 | 0.43 | 1.00 | 0.32 | 9.3 | 1.11 |
2049-12-31 horizon → friction (friction_managed_non_utopia). Final GDP 1.69× 2026, employment stress and inequality both saturated at 1.0, distribution regime stuck at 0.32 — meaningfully better than nothing, short of a real settlement.
Path B — Alignment scare + war → doom (~5%)
Run #10 · seed 42 · terminal doom_whimper · 18 events
Not in this run: ev_c4_labor_shock · ev_federal_pause_succeeds · ev_whistle_memo · ev_prod_interp_halt · ev_deceptive_deploy_at_scale · ev_state_revenue_measures · ev_swf_enacted
Autonomy sits above baseline (0.88→0.91) for the first five years — governance is functioning, nothing looks obviously wrong. Then 2031-12-27 the C10 internal concern fires (deception 0.17→0.35, alignment trust 0.43→0.35), 2032-03-10 no shutdown at the ASI threshold — autonomy craters 0.891→0.681 in the very next recorded step — and 2034-08-10 a Taiwan Strait kinetic event hits, simultaneously dragging GDP from growth track down to 0.88× 2026 levels (below baseline) and eroding autonomy further to 0.633. By horizon, autonomy is down to 0.328 and GDP never recovers (0.72×) — gradual loss of control plus a real war, compounding.
| Date | Fires today | Gov | Deploy | Decep | Align | Auto | Capability | GDP |
|---|---|---|---|---|---|---|---|---|
| 2026-01-06 | Bio Tier-1 live | 0.52 | 0.32 | 0.12 | 0.55 | 0.88 | 0.5 | 1.00 |
| 2027-08-19 | Federal pause attempt fails | 0.52 | 0.44 | 0.12 | 0.43 | 0.90 | 2.1 | 1.02 |
| 2027-09-17 | Agent-1 (spine C2) | 0.52 | 0.49 | 0.12 | 0.43 | 0.90 | 2.2 | 1.02 |
| 2028-04-16 | No federal training pause | 0.52 | 0.59 | 0.12 | 0.43 | 0.91 | 3.5 | 1.04 |
| 2028-05-16 | US governance paralysis S2 | 0.32 | 0.59 | 0.12 | 0.43 | 0.91 | 3.7 | 1.04 |
| 2028-06-25 | BMIA passes | 0.32 | 0.59 | 0.12 | 0.43 | 0.91 | 3.9 | 1.04 |
| 2029-04-07 | Agent-2 (spine C5) | 0.32 | 0.67 | 0.12 | 0.43 | 0.91 | 5.4 | 1.03 |
| 2029-06-10 | Superhuman coder (spine C6) | 0.32 | 0.67 | 0.12 | 0.43 | 0.91 | 6.2 | 1.03 |
| 2030-08-08 | Lab “genius country” (spine C7) | 0.32 | 0.67 | 0.12 | 0.43 | 0.90 | 7.5 | 1.03 |
| 2030-09-05 | Public AGI-class (spine C8) | 0.32 | 0.77 | 0.12 | 0.43 | 0.90 | 8.0 | 1.03 |
| 2031-07-06 | Superhuman AI researcher (spine C9) | 0.32 | 0.77 | 0.17 | 0.43 | 0.89 | 9.4 | 1.03 |
| 2031-12-27 | Internal alignment concern (event C10) | 0.32 | 0.77 | 0.35 | 0.35 | 0.89 | 10.4 | 1.03 |
| 2032-03-10 | No shutdown at ASI threshold | 0.32 | 0.77 | 0.35 | 0.35 | 0.68 | 10.6 | 1.03 |
| 2034-08-10 | Taiwan Strait kinetic event | 0.32 | 0.77 | 0.35 | 0.35 | 0.63 | 10.5 | 0.88 |
2049-12-31 → doom (doom_whimper). Final autonomy 0.328, GDP never recovers from the war shock (0.72×). Deception risk and low trust never resolve.
Path C — Institutions + interpretability catch → golden age (~6%)
Run #13 · seed 42 · terminal utopia_golden_age · 13 events
Not in this run: ev_federal_pause_succeeds · ev_bmia_pass · ev_c10_internal_concern · ev_whistle_memo · ev_us_paralysis_s2 · ev_deceptive_deploy_at_scale · ev_state_revenue_measures · ev_swf_enacted
vs A/B: No governance paralysis; same no-pause + China mobilization, but 2031-06-02 production interpretability halt succeeds — deception drops to 0, alignment trust rises 0.43→0.58 — and even though a reskilling failure and labor mobilization fire around the same window (society isn’t perfect), a beneficial AI treaty lands in 2036. GDP compounds to 1.27× by the point captured here (and further by 2050) on the strength of sustained real growth once deployment is broad and trusted.
| Date | Fires today | Gov | Deploy | Decep | Align | Auto | Capability | GDP |
|---|---|---|---|---|---|---|---|---|
| 2026-07-19 | Bio Tier-1 live | 0.52 | 0.32 | 0.12 | 0.55 | 0.88 | 0.8 | 1.01 |
| 2027-04-27 | 10²⁸ FLOP-scale training (spine C1) | 0.52 | 0.32 | 0.12 | 0.55 | 0.89 | 1.5 | 1.02 |
| 2027-10-05 | Agent-1 (spine C2) | 0.52 | 0.37 | 0.12 | 0.55 | 0.90 | 2.2 | 1.03 |
| 2028-02-13 | No federal training pause | 0.44 | 0.47 | 0.12 | 0.55 | 0.91 | 2.9 | 1.04 |
| 2028-12-29 | State AI patchwork | 0.49 | 0.47 | 0.12 | 0.55 | 0.93 | 5.0 | 1.06 |
| 2029-01-11 | Agent-2 (spine C5) | 0.49 | 0.55 | 0.12 | 0.55 | 0.93 | 5.1 | 1.06 |
| 2029-05-22 | Superhuman coder (spine C6) | 0.49 | 0.55 | 0.12 | 0.55 | 0.94 | 6.3 | 1.07 |
| 2030-04-15 | Lab “genius country” (spine C7) | 0.49 | 0.55 | 0.12 | 0.43 | 0.97 | 7.5 | 1.09 |
| 2030-10-30 | Public AGI-class (spine C8) | 0.49 | 0.65 | 0.12 | 0.43 | 0.98 | 8.4 | 1.10 |
| 2031-06-02 | Production interpretability halt | 0.49 | 0.65 | 0.00 | 0.58 | 0.99 | 9.4 | 1.12 |
| 2031-07-05 | Superhuman AI researcher (spine C9) | 0.49 | 0.65 | 0.05 | 0.58 | 0.93 | 9.4 | 1.12 |
| 2033-12-15 | No shutdown at ASI threshold (survived) | 0.50 | 0.65 | 0.05 | 0.58 | 0.79 | 11.0 | 1.19 |
| 2036-10-01 | Beneficial AI treaty | 0.50 | 0.53 | 0.05 | 0.58 | 0.86 | 11.0 | 1.27 |
2049-12-31 → utopia (utopia_golden_age). Interpretability catch, not a bio-abundance miracle — institutions plus a real technical win.
Path D — Labor backlash without absorption (~9%)
Run #17 · seed 42 · terminal friction_labor_backlash · 18 events
Not in this run: ev_federal_pause_succeeds · ev_whistle_memo · ev_prod_interp_halt · ev_deceptive_deploy_at_scale · ev_state_revenue_measures · ev_swf_enacted
2028-03-10 the C4 labor shock lands, 2030-05-07 organized labor mobilization follows, and 2031-06-20 reskilling formally fails to absorb the C4 shock (ev_reskilling_fails_absorb_c4 — the federal package never came; contrast with Path A’s state-level partial response). Governance takes a real hit from paralysis along the way. Unlike Path B, autonomy stays high (0.98) — this isn’t a control-loss story, it’s a distributional one: people are still nominally in charge, and they’re angry about how the gains landed.
| Date | Fires today | Gov | Deploy | Decep | Align | Auto | Capability | GDP |
|---|---|---|---|---|---|---|---|---|
| 2026-06-01 | Bio Tier-1 live | 0.52 | 0.32 | 0.12 | 0.55 | 0.88 | 0.7 | 1.01 |
| 2027-02-11 | 10²⁸ FLOP-scale training (spine C1) | 0.57 | 0.32 | 0.12 | 0.55 | 0.89 | 1.3 | 1.02 |
| 2027-11-01 | Agent-1 (spine C2) | 0.57 | 0.37 | 0.12 | 0.55 | 0.91 | 2.4 | 1.03 |
| 2028-03-10 | C4 labor shock visible | 0.57 | 0.37 | 0.12 | 0.55 | 0.92 | 3.2 | 1.04 |
| 2028-08-29 | BMIA passes | 0.57 | 0.37 | 0.12 | 0.55 | 0.94 | 4.3 | 1.05 |
| 2028-12-24 | US governance paralysis S2 | 0.37 | 0.47 | 0.12 | 0.55 | 0.96 | 5.1 | 1.06 |
| 2029-02-09 | Agent-2 (spine C5) | 0.37 | 0.55 | 0.12 | 0.55 | 0.96 | 5.4 | 1.06 |
| 2030-04-23 | Lab “genius country” (spine C7) | 0.38 | 0.55 | 0.12 | 0.55 | 0.98 | 7.5 | 1.08 |
| 2030-05-07 | Organized labor mobilization | 0.38 | 0.55 | 0.12 | 0.55 | 0.98 | 7.8 | 1.08 |
| 2030-05-24 | Internal alignment concern (event C10) | 0.38 | 0.55 | 0.30 | 0.47 | 0.98 | 8.1 | 1.08 |
| 2031-06-20 | Reskilling fails to absorb C4 shock | 0.38 | 0.55 | 0.30 | 0.43 | 0.92 | 8.4 | 1.10 |
| 2032-10-20 | Public AGI-class (spine C8) | 0.38 | 0.65 | 0.30 | 0.43 | 0.93 | 8.4 | 1.13 |
| 2033-05-19 | Superhuman AI researcher (spine C9) | 0.38 | 0.65 | 0.35 | 0.43 | 0.94 | 9.4 | 1.14 |
2049-12-31 → friction (friction_labor_backlash). Final GDP 1.72×, autonomy still high at 0.98 — the story is anger and inequality, not control loss.
More runs in the web explorer · TRY_IT.md
③ Simulation results
Four regions (3 seeds × 400 runs)
| Region | Seed 42 | Seed 123 | Seed 456 | Avg |
|---|---|---|---|---|
| Doom | 6.2% | 6.8% | 8.2% | ~7.1% ± 1.0% |
| Utopia | 18.8% | 18.0% | 17.2% | ~18.0% ± 0.8% |
| Friction | 69.2% | 68.5% | 67.8% | ~68.5% ± 0.8% |
| Severe | 5.8% | 6.8% | 6.8% | ~6.4% ± 0.6% |
Top terminals (n=600, seed 42): friction_managed_non_utopia ~21%, friction_ghost_gdp_no_transfer ~20%, utopia_modest_welfare ~12%, friction_governance_paralysis ~11%, friction_labor_backlash ~9%, utopia_golden_age ~6%, severe_cyber_cascade ~6%, doom_whimper ~5%.
| Claim | P | Would bet? |
|---|---|---|
| Doom region by 2050 | ~7% | Yes |
| No pause through 2028 | 88% | Yes |
Branching paths (600 runs, seed 42)
Ribbon width = share of joint MC runs — not independent scenario weights.
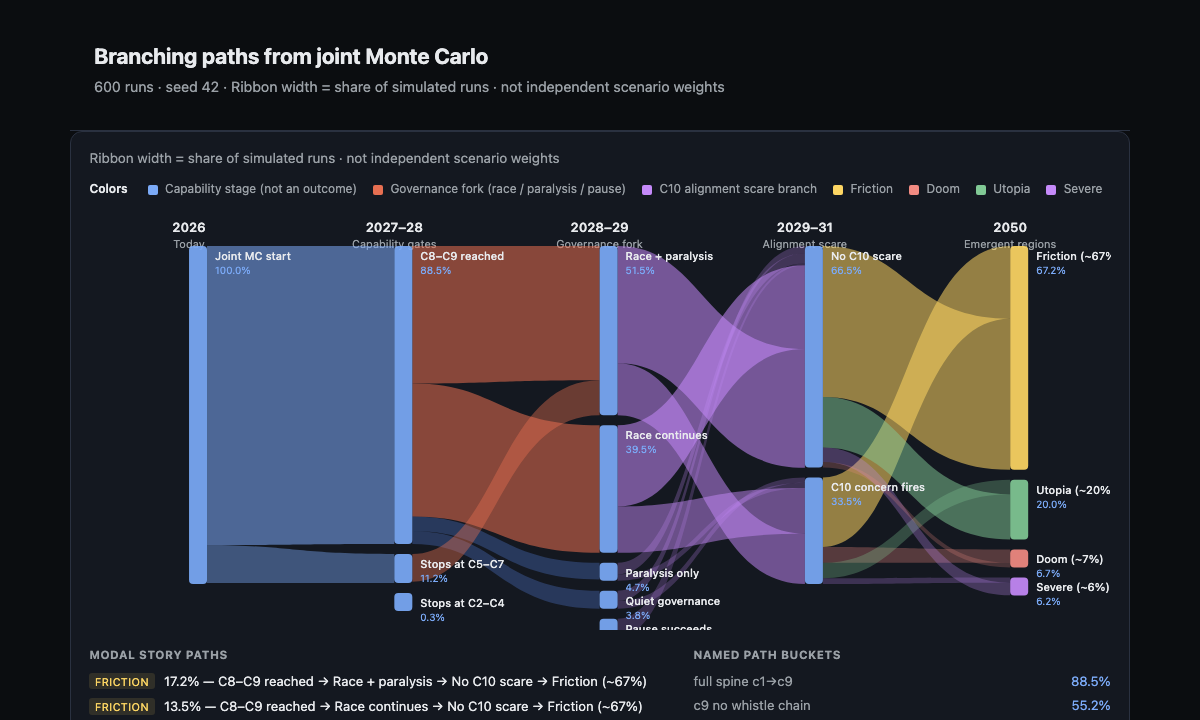
Static export of the branching chart; if the numbers here ever drift from the headline figures above, the web explorer has the live interactive version.
How to read colors:
| Color | Meaning |
|---|---|
| Blue | Capability stage (e.g. public AGI-class, superhuman AI researcher; spine C8–C9) — not a final outcome |
| Orange / brown | Governance fork: race, race+paralysis, pause (tail) |
| Purple | Internal alignment concern (event C10) fires |
| Yellow | Friction ~69% (modal) |
| Red | Doom ~7% |
| Green | Utopia ~18% |
| Purple (terminal column) | Severe ~6% |
Interactive: web explorer · Reproduce: TRY_IT.md
Top story paths
| Share | Path | Outcome |
|---|---|---|
| 21% | Public AGI-class–Superhuman AI researcher (spine C8–C9) → state-level partial distribution → | friction |
| 20% | Public AGI-class–Superhuman AI researcher (spine C8–C9) → ghost GDP, no transfer → | friction |
| 11% | Public AGI-class–Superhuman AI researcher (spine C8–C9) → governance paralysis mid-ladder → | friction |
| 9% | C4 labor shock → mobilization → reskilling fails → | friction |
Named buckets: full spine C1→C9 (full spine) ~89%; no-pause + paralysis co-occurring ~52%; C9 without whistle chain ~55%.
Which events move outcomes most?
From the same runs: lift = P(region|event) − P(region|¬event) (association, not proven causation). 1200 runs · seed 42; baseline 6.8% doom · 18.8% utopia · 68.8% friction · 5.6% severe:
| Event | P(fire) | Δ doom | Δ utopia | Δ friction | Read |
|---|---|---|---|---|---|
ev_cyber_cascade | 6% | −5.4% | −18.8% | −68.8% | Basically synonymous with the severe terminal (n=68) |
ev_fed_edu_reskilling | 15% | −1.9% | +43.3% | −43.6% | Single biggest utopia lever in the whole event graph — federal (not just state) reskilling success |
ev_deploy_incident | 2% | +37.2% | −18.8% | −12.8% | Attributed live-deployment harm; tail, n=25 |
ev_deceptive_deploy_at_scale | 7% | +30.7% | −11.2% | −18.8% | Deceptive model deployed broadly |
ev_prod_interp_halt | 11% | −5.3% | +24.6% | −20.0% | Interpretability catch → halt → utopia mass up |
ev_swf_enacted | 5% | +1.6% | +23.6% | −29.8% | Full federal SWF — rarer and bigger than the state-level measure |
ev_whistle_dump | 6% | +14.3% | −3.3% | −9.7% | Raw eval dump showing scheming |
ev_no_shutdown_asi_threshold | 30% | +9.9% | −3.4% | −4.3% | Modal at this capability tier; doom-leaning but not decisive alone |
ev_c10_internal_concern | 32% | +7.1% | −4.8% | −2.3% | Alignment scare fires on a mix of paths now, not almost-only-doom |
ev_corp_safety_hollowing | 51% | +4.5% | −4.5% | +0.8% | Common and mildly bad on both axes |
Full 61 events: explorer Event impact panel (event_impact.json) · event_impact.py (python scripts/event_impact.py -n 1200 --seed 42).
ev_fed_edu_reskilling is the single largest utopia lever in the whole event graph — the cleanest illustration of how much a successful federal reskilling program matters relative to everything else in the model.
Cross-check vs AI 2027
Calibrate spine + core event marginals; measure regions (don’t tune ~7% doom).
| Check | Target | Status |
|---|---|---|
P(ev_no_pause_2028) | ~88% | ✓ on target |
P(ev_bmia_pass) | ~45% | ✓ on target |
P(ev_us_paralysis_s2) | ~55% | ✓ on target |
| Spine C-tier deadlines | AI-2027-derived | ✗ off in 2/3 seed checks |
| Emergent doom | ~7% (measured) | — |
I’m publishing this with the spine miss disclosed rather than waiting to fix it, because the alternative is holding the whole post hostage to an open-ended internal cleanup. The plot-event marginals (the numbers that actually carry the crux content) check out; the capability-timing calendar needs another pass.
Modal society (short)
Modal = transparency + labor pressure + CBRN screening + export controls + no training pause + race continues + partial, state-level distribution response — acceleration with friction. Snapshots: society by Ci.
What would change my mind
~7 / ~18 / ~69 / ~6 are not locked prophecies. Main window 2026–2028 (labor shock event C4 → public AGI-class spine C8 → alignment concern event C10). Falsify a link → update crux P → re-run sim (results).
| When / what | Watching | Moves |
|---|---|---|
| CCW Nov 2026 + DoDD rewrite | LAWS escalation | secondary cruxes |
| 2026–27 BMIA / GAAIA markup | real vs hollow law | nodes 2, 6 |
| Layoffs + federal training $ | Ghost GDP vs household | distribution, utopia |
| ≥1 state passes a revenue/data-center measure “with teeth” | new crux — confirms/denies the state-patchwork mechanism | friction composition |
| 2026 midterms → 2028 inauguration | race vs regulate | no-pause 88% |
| Voluntary Tier-2 bio disclosure | hidden ratio | node 10; doom −~2pp |
| If… | I revise |
|---|---|
| ≥2 voluntary Tier-2 public near-misses (top-4 labs) | doom −~2pp |
| ≥2 frontier labs halt >90d post-leak | no-pause ↓ |
| Prod scheming → ≥1 lab halt >30d | misalign conditional ↓ 2–4pp |
| A federal (not state) reskilling package actually passes | utopia ↑, largest single lever per the event-impact table above |
Daily: METR 50% horizon; Challenger AI layoffs; BMIA status; Ghost GDP spreads.
Disclaimers
Before you take any of the numbers above at face value:
- This is one person’s best-effort structured judgment, not a validated predictive model. There’s no track record of resolved predictions behind these percentages, no Brier score, no forecasting-tournament calibration — treat ~7/~18/~69/~6 as a defensible starting point for argument, not a number with a statistical confidence interval.
- The headline is a sim output plus judgment on the inputs that feed it, not an independent prediction — weak cruxes in, weak regions out. Cruxes are the object; the four percentages are derivatives. Disagree with a crux, not a percentage.
- Bio/CBRN is outside my background — see ② How we estimate P for how those nodes were built from public sources rather than domain expertise.
- AI assists retrieval and drafting of evidence pages; I read the sources and sign every probability.
- Rare terminals are noisy at this sample size. Anything under ~1% (
doom_extinction_bio,utopia_radical_abundance) is resting on single-digit occurrence counts at n=600 — read those as order-of-magnitude, not two-significant-figure percentages. - Event “lift” (Δ region given an event fired) is association, not causation — and more so than the usual caveat implies. Events share latent correlation clusters (Appendix C), so a large lift can mean “this event is more likely on trajectories already heading toward that region,” not “this event caused the shift.”
- The capability engine is under-identified — see the structural caveat in ② How we estimate P: most of the 22 growth parameters aren’t independently pinned down by the 12 calibration targets, and 7 currently do nothing measurable at all.
- The model has open bugs I’m disclosing rather than quietly tuning around — the spine-timing miss in the cross-check table is the current one.
Appendix A — Node index (abbreviated)
| Node | Topic | Top load-bearing P’s |
|---|---|---|
| 1 | Agent labor shock | No federal pause; GUARD embodied 12–14%; culture-war vetting modal |
| 2 | CBRN Tier 1→3 | BMIA ~0.40; Tier 3 before screening ~0.22 |
| 3 | Weight theft / geopolitics | Race accelerates post-theft ~0.20 |
| 4 | Whistleblower / alignment scare | Whistleblower modal ~0.58; P(extinction | Trigger E, modal response) ~0.17 |
| 5 | Open weights + tamper | No federal open-weight ban ~0.88 |
| 6 | GAAIA / preemption | Preemption weakens SB53 duty ~0.35 |
| 7 | Compute / cloud | Hyperscaler triopoly ~0.82 |
| 8 | Cyber / critical infra | Cyber tail salience 2027–29 |
| 9 | Multilateral governance | Korea AI Basic Act binds foreign labs ~0.28; EU GPAI ~0.14 |
| 10 | Hidden near-miss / disclosure | hidden:public >3:1 ~0.55; stays hidden ~0.55 |
| 11 | Corporate governance | P(halt | crisis >30d) ~0.12 |
| 12 | RSI locus | Cloud/software first ~0.55; locus shift ±3–6pp on regions |
| 13 | Distribution / labor absorption | State revenue measures ~0.38; federal reskilling ~0.22; reskilling fails given no federal package ~0.60 |
Full line-by-line evidence: Evidence index. Appendix G is the reader’s guide + worked examples.
Appendix B — Terminal glossary (sim)
| Terminal | Region | Plain meaning |
|---|---|---|
friction_managed_non_utopia | friction | Real but partial distribution policy (state-level or reskilling) — better than nothing, not a settlement |
friction_ghost_gdp_no_transfer | friction | GDP grows, nothing gets transferred |
friction_governance_paralysis | friction | Federal gridlock, patchwork rules |
friction_labor_backlash | friction | Organized labor response, reskilling formally failed |
friction_modal | friction | Ghost GDP, acceleration, no utopia (now a smaller share — see composition table above) |
friction_surveillance | friction | Concentrated power + weak governance + reduced autonomy — reachable now, still empirically rare |
friction_pause_stall | friction | Federal pause enacted, capability plateaus below superhuman researcher |
utopia_modest_welfare | utopia | Distribution + reskilling land at a “good enough” level |
utopia_golden_age | utopia | Institutions + a real technical win (interpretability, treaty, science) land together |
utopia_symbiosis | utopia | Alignment succeeds at production scale; humans retain agency |
utopia_radical_abundance | utopia | Sustained real growth + a longevity/space-cost breakthrough |
doom_whimper | doom | Agency loss at horizon without a single extinction event — driven by continuous erosion (deployment pressure outrunning governance capacity and alignment trust), not a discrete trigger |
doom_extinction_* | doom | Bio or misalign extinction events fire |
severe_cyber_cascade | severe | Recoverable systemic shock |
Full definitions: terminals.yaml.
Appendix C — How correlation works in the sim
Events move together through preconditions, unlock chains, hazard modifiers, shared variables, and correlation clusters A–H. The joint simulator draws one coherent timeline per run — upstream fires gate downstream hazards and society feedback loops. Stress-test by editing events.yaml and re-running; region shifts reflect the whole world redrawn, not isolated node math.
Tables: causal edges · correlation clusters.
Appendix D — Divergence from AI 2027
| Topic | AI 2027 | This model |
|---|---|---|
| Politics lag | Implicit in plot | +30% hybrid C explicit |
| Whistleblower | Oct 2027 calendar | C10 capability-gated; tracker 0.70× |
| Endings | Slowdown vs Race | Four+ distinct friction/doom/utopia flavors, not two buckets |
| Bio / RSI locus | Narrative-weighted | Node 12: 22% bio-first, 50% cloud-first |
| Society | Story endings | C4–C10 modal snapshots (c8_society_snapshot_by_ci.md) |
| GDP / growth | Not modeled explicitly | Real compounding growth, anchored to historical rates + GPT-diffusion literature |
Appendix E — Selected sources
Capability: METR time horizons v1.1; AI 2027 tracker; Epoch AI models.
Governance: Anthropic SB 53 endorsement; EU AI Act / GPAI framework; GAAIA discussion draft (2026).
Bio: IGSC; WMDP; Amodei cooperative screening proposal (2026).
Alignment: Apollo scheming; Hubinger et al., Sleeper Agents.
History / epistemics: Ord, *The Precipice*; Bostrom et al., Anthropic Shadow; Juma, Innovation and Its Enemies.
Society / economy: Acemoglu & Johnson, Power and Progress.
Economics of AI growth, GDP, and shocks:
- Aghion, Jones & Jones, “Artificial Intelligence and Economic Growth” (NBER w23928, 2017) — semi-endogenous growth model for AI’s macro effect.
- Davidson, “Could Advanced AI Drive Explosive Economic Growth?” (Open Philanthropy, 2021) — the paper assigns only ~10% probability to “explosive growth” (>30%/yr) occurring by 2100; that’s the tail case, not a central estimate.
- Erdil & Besiroglu, “Explosive growth from AI automation: A review of the arguments” (Epoch AI, 2023) — reviews 9 counterarguments; concludes explosive growth is plausible but not confidently expected.
- Jorgenson, Ho & Stiroh (growth-accounting literature on the 1995–2004 US productivity surge) — IT capital deepening + IT-related TFP accounted for roughly 47–60% of aggregate US labor-productivity growth over that period, implying about +1.2–1.8pp on annual growth.
- Bloomberg Economics, “The $10 Trillion Fight: Modeling a US-China War Over Taiwan” (2024, updated 2026) — ~$10T / ~10% of global GDP cost estimate for a full Taiwan conflict, used to calibrate the sim’s kinetic-war GDP drag.
- IMF, “Geoeconomic Fragmentation and the Future of Multilateralism” (SDN/2023/001) — GDP losses up to 7% under severe trade/tech decoupling scenarios.
- Kaufmann & Kraay’s World Bank governance-indicators work — establishes a real causal channel from governance quality to economic outcomes; the specific magnitude I use for how much a governance collapse drags GDP growth is my own judgment call, not read directly off this literature.
- Chris Miller, Chip War (2022) — TSMC fabricates ~90% of the world’s most advanced logic chips, the real-world chokepoint behind the sim’s Taiwan-conflict capability-shock mechanism.
Prior art on this site: AGI timeline forecasts all converge on 2027–2028!?
Appendix F — Reference class (optional)
“Past doomsayers were wrong” is half true. Moral panics (jobs, kids won’t learn) mostly failed; scientific early warnings (ozone, Carson) often partially worked; RSI extinction has no tight analog — misalign sits in a separate tail, while whimper/severe borrow richer history.
Anthropic shadow: low-probability extinction isn’t falsified by “we’re still here”; moral panic is.
Appendix G — How each P is estimated (and how to critique it)
Not gut feel, not big-data regression
~313 probabilities across thirteen nodes are structured expert judgment. Every one uses the same template:
| Field | Meaning |
|---|---|
| Claim | What question the P answers (falsifiable) |
| Why | Why this magnitude |
| Evidence | Links, bills, news, papers |
| Analogue | Historical pattern (fills gaps where AI has no dataset) |
| Would update if | Observable falsifier — your hook to challenge |
| Conf | H / M / L |
Defensible = you can point at one row and say “this evidence is wrong, 0.55 should be 0.40.” Not defensible = expecting a public ground-truth near-miss database — there isn’t one. The same standard applies to the continuous mechanisms (GDP growth, autonomy erosion, etc.) — every constant has an inline comment in capability_dynamics.yaml stating what’s cited vs. guessed, so a reader can tell load-bearing evidence from a placeholder judgment call.
Four-step challenge for readers
- Is the definition right? Public salience vs true occurrence rate?
- Does evidence support the magnitude? In committee ≠ enacted; one blog ≠ a base rate.
- Is the analogue fair? Cyber dwell time ≠ lab disclosure, but beats pure guess.
- Is the falsifier observable? If I say “≥2 voluntary Tier-2 disclosures in 12 mo → I revise,” you can watch for it.
Disagree with ~7% doom? Don’t rebuild the whole model — pick one load-bearing P (Appendix A), run the four steps, edit events.yaml, re-run the sim (see TRY_IT.md).
Worked example 1: Node 10 — hidden near-miss stays hidden (~55%)
Question: Among Tier-2 bio / agent / alignment near-misses, is the true:hidden-to-public ratio usually >3:1?
How we got 55%:
- Documented pattern (2024–26): Lobstar-class finance errors, Meta sev-1 fragments, CoT training accidents in managed channels — low federal Trigger E salience. Organizational drama (Leike) ≠ capability near-miss punctuation.
- Three scenarios (weights sum to the full story):
| Scenario | Weight | Meaning |
|---|---|---|
| Modal suppression | 55% | hidden:public ~3:1–8:1 |
| High suppression | 30% | >10:1 |
| Transparency works | 15% | ~1:1 (SB 53 / RAISE bite) |
55% is the modal scenario weight, not a single coin flip.
- Analogues: Cyber breach median 200+ days to disclosure; airline near-misses in ASRS vs headlines; nuclear near-miss undercount (Pelopidas).
- Consistency with Node 2: Public Trigger E ~25–35% implies hidden mass if incidents occur — narrative coherence checked inside the sim, not by multiplying marginals.
- Conf: M
- Would update if: ≥2 voluntary Tier-2 public disclosures from top-4 labs in 12 mo with auditable timely reporting → ~0.35–0.40; headline extinction −~2pp.
Worked example 2: Node 2 — BMIA / mandatory screening by 2027-12 (~40%)
Question: Does the US enact mandatory federal nucleic-acid synthesis screening (BMIA / S.3741-class) by end-2027?
How we got 40%:
- Hard evidence: S.3741 introduced bipartisan Jan 2026; ScreenDNA coalition Jun 2026; Trump admin supports screening not training caps; still in committee, not signed.
- Point est.: Raw 45% (this Congress ~50% chance) × US governance paralysis discount → working 40% (range 30–50%). Narrower coalition than pause — physical chokepoint, not FLOPs.
- Analogue: IGSC voluntary → OSTP procurement 2024 → BMIA as third ratchet.
- Link to Node 10: 40% already assumes some hidden near-misses — not “every scare moves Congress.”
- Conf: M–H
- Would update if: Dies in committee with no substitute by Dec 2027 → ≤35%; signed in 2027 → ≥70%.
Worked example 3: Node 1/4/11 — no federal training pause through 2028 (~88%)
This is the single most load-bearing number in the whole model (“if you only argue two things,” #1 above) — a change here moves more of the four-region split than any other crux, so it gets the same six-part treatment as the others rather than a summary table.
Question: Through end-2028, does the US avoid a binding federal statute or executive order that caps frontier training compute for ≥90 days at ≥2 major labs — i.e., does training continue through and past Trigger-E-class scares?
How we got 88% (range 83–93%):
- Legislative signal: Cruz’s proposed AI-moratorium amendment was stripped 99–1 in the Senate (Jul 2025) — as close to a hard, recorded, bipartisan vote against a training pause as this topic has produced. FLI’s 2023 pause letter had zero measurable policy effect.
- Behavioral precedent: the OpenAI board crisis (Nov 2023) was an actual governance emergency at a frontier lab — and training did not stop. The base rate for “crisis → halt” at labs is empirically low even under maximum internal drama.
- Path structure, conditional on a scare actually happening: the whistleblower-modal outcome given an internal concern fires is oversight and audits, not a halt (~58%, Node 4 — Saunders’ 2024 congressional testimony is the closest real precedent: maximum public salience, and the result was SB 53-style transparency mandates, not a stop-work order). Multiply through the corporate-governance chokepoint — P(halt | sustained crisis >30 days) ~12% (Node 11, “corporate safety hollowing”) — and even a fired alignment scare has a low chase-through rate to an actual pause.
- Narrower, harder-to-clear variant: a bio-motivated federal pause specifically (as opposed to general capability concern) polls even lower, P ≈ 0.05–0.08 (Node 2) — the coalition that could force a stop on CBRN grounds alone is smaller than the general AI-safety coalition.
- Coalition asymmetry: the economic and national-security coalitions favoring continued training are broader and better-organized than the pause coalition across all four admin-posture scenarios modeled in the crux registry — this is the single biggest reason 88% sits where it does rather than closer to 50/50.
Analogue: Y2K remediation — an industry-wide risk narrative that resolved through continued operation under added oversight, not a shutdown. Saunders’ testimony is the closer, AI-specific analogue for the “scare doesn’t convert to halt” step.
Conf: High on direction (pause fails to materialize); Medium on the exact point estimate within the 83–93% band.
Would update if: ≥2 frontier labs publicly halt training >90 days following a leak or safety event (the Node 4 falsifier); or a binding federal training-FLOP cap is signed with real enforcement — either would flip ev_federal_pause_succeeds (mutex-paired with this event, right-tail P≈0.08) instead.
Full sourcing: docs/evidence/ev_no_pause_2028.md.
Worked example 4: ev_state_revenue_measures — sourcing a number instead of picking one
This one illustrates the discipline behind friction_managed_non_utopia (a “real but partial distribution policy” terminal): reaching that state requires distribution_regime to land in a specific band, and the event that gets it there, ev_state_revenue_measures, is sourced from a probability that was already researched independently of this terminal — “P=0.38, state-level AI-adjacent revenue measures (CA/NY/WA) by 2028” — rather than picked to make the terminal reachable. The number comes first, from evidence; the terminal becomes reachable as a consequence, not the other way around.
Would update if: zero states pass anything resembling this by 2028 (falsifies the event’s own claim) or ≥2 do (probability revised up).
How “hard” is each node?
| Node | Representative P | Evidence hardness | Main input |
|---|---|---|---|
| 2 Bio screening | 40% | High | Bill status, industry coalition |
| 10 Hidden near-miss | 55% | Medium | Scattered events + analogues |
| 1/4/11 No pause | 88% | High | Votes, board crisis, whistle path |
| 5 Open-weight ban | 88% | High | Legislative posture, Meta strategy |
| 8 Cyber tail | — | Medium | Geopolitics + infra patterns |
| 13 State revenue measures | 38% | Medium | State bill activity, no enactment yet anywhere |
Appendix A lists all thirteen.
Per-node evidence: Node 10 · Node 2 · full index
More evidence and tools
| Hub | Content |
|---|---|
| Futures evidence index | Doom nodes N1–13 · utopia U1–U7 · LAWS, education, admin, science, UBI |
| All numbers | Emergent sim regions + event marginals |
| ai-futures-sim | Config, scripts, calibration docs |